Web GIS Dashboards
A glimpse into our Web GIS Dashboards
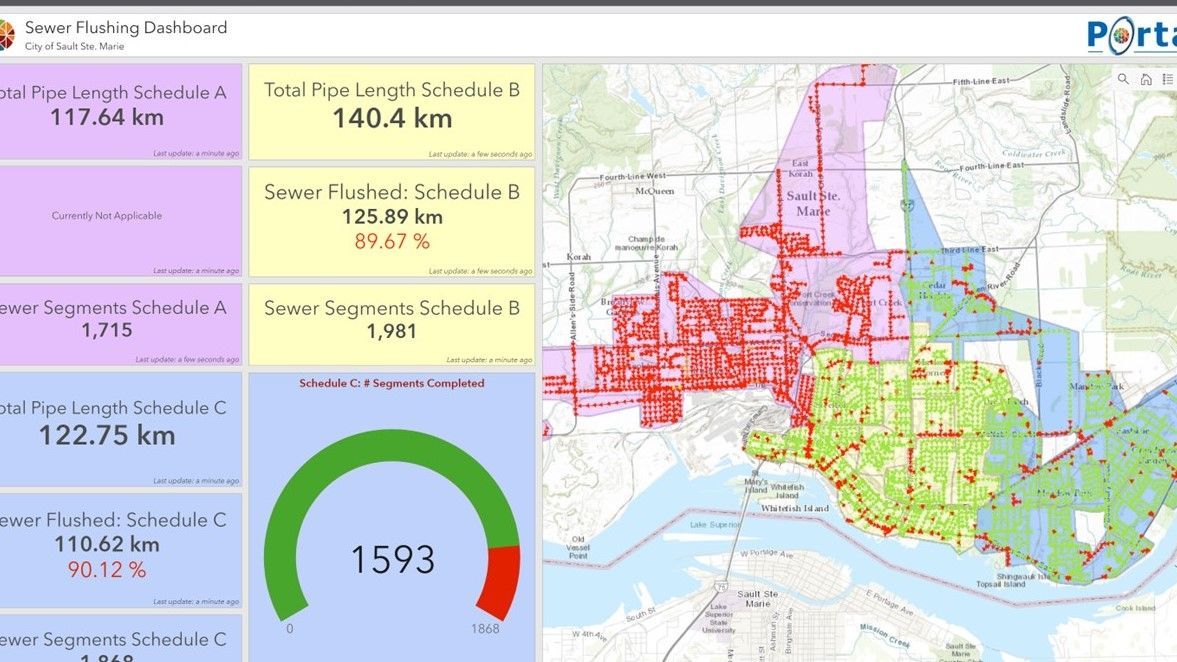
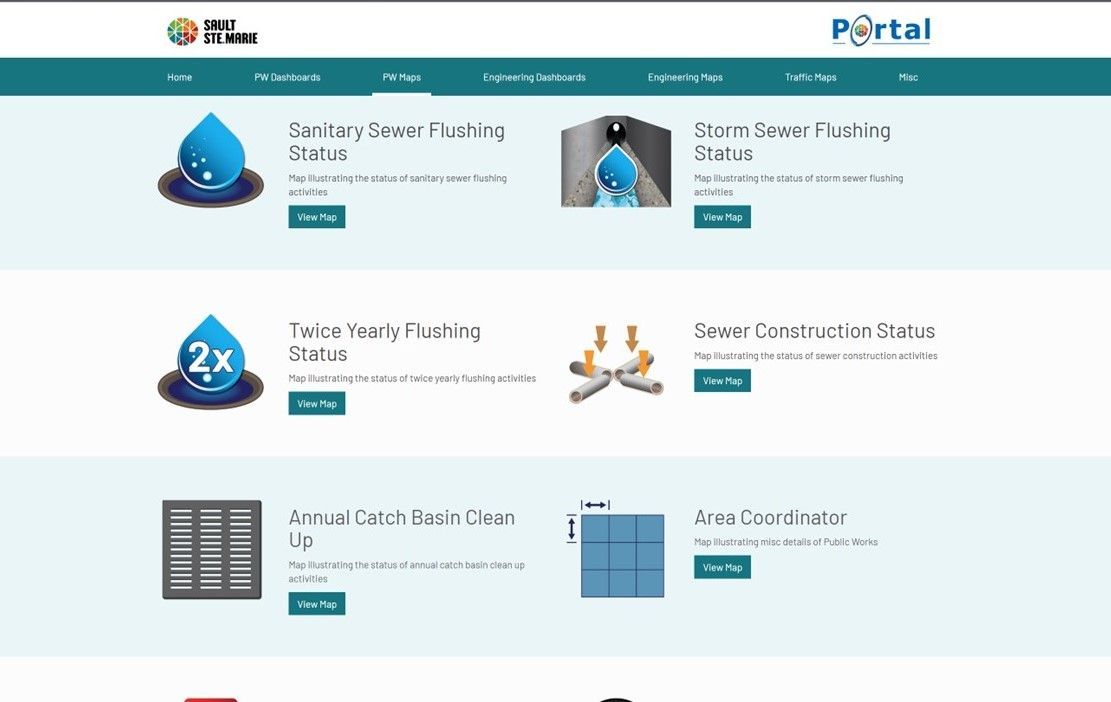
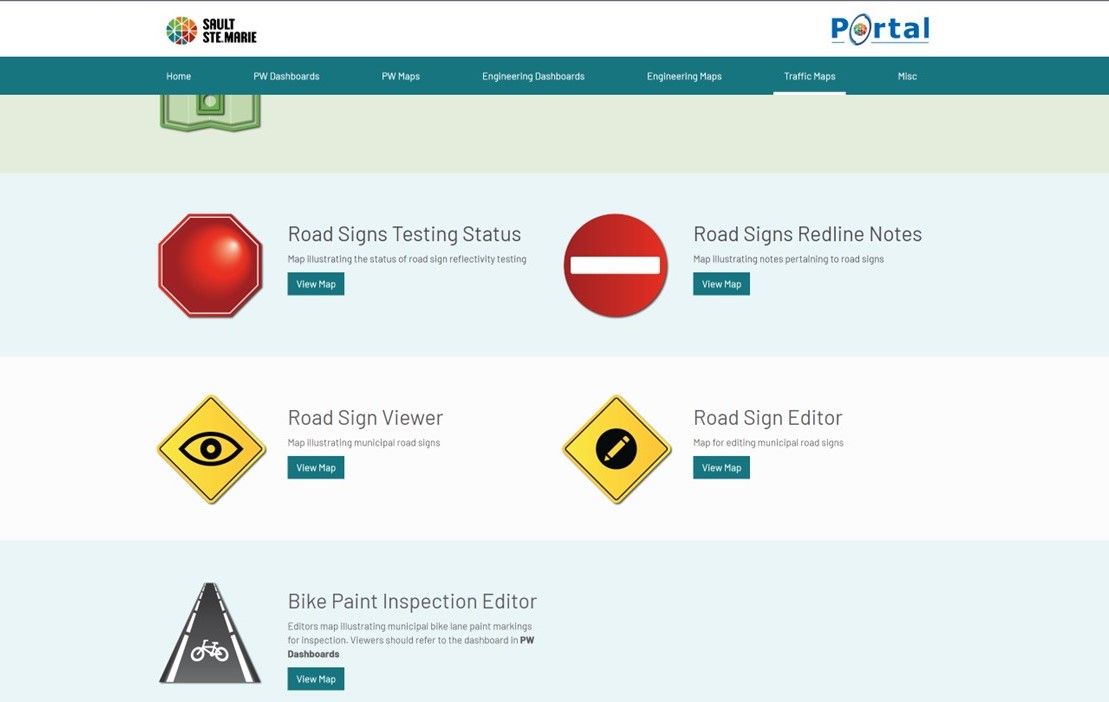
A dashboard is a series of statistics that are aided by maps. Decision-makers can easily see status and metrics, making it efficient and accessible to manage your municipal utilities. The images below are examples of just a few of our Web GIS Dashboards
Sewer Flushing Dashboard
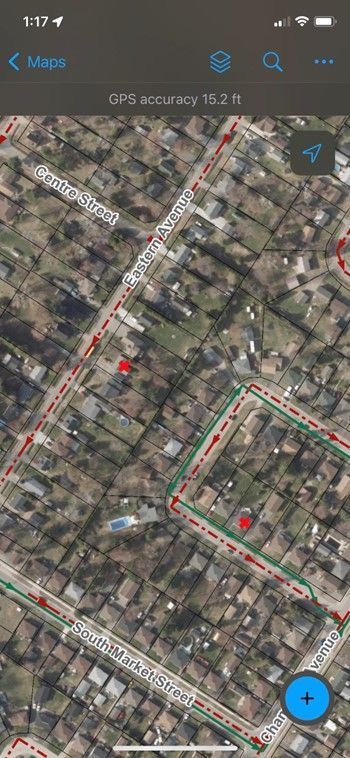
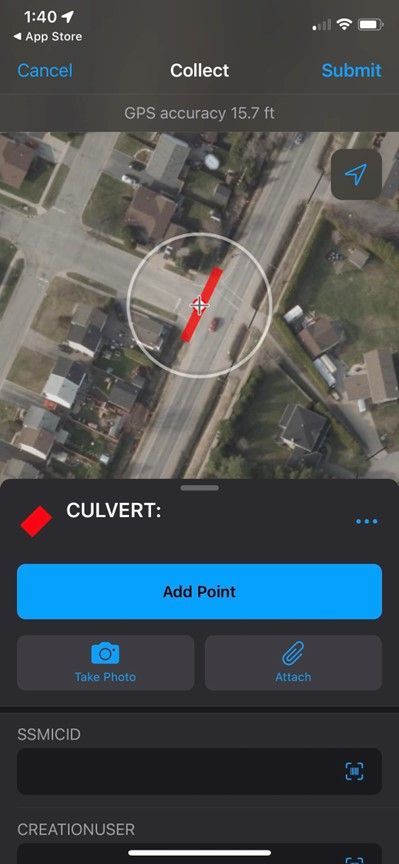
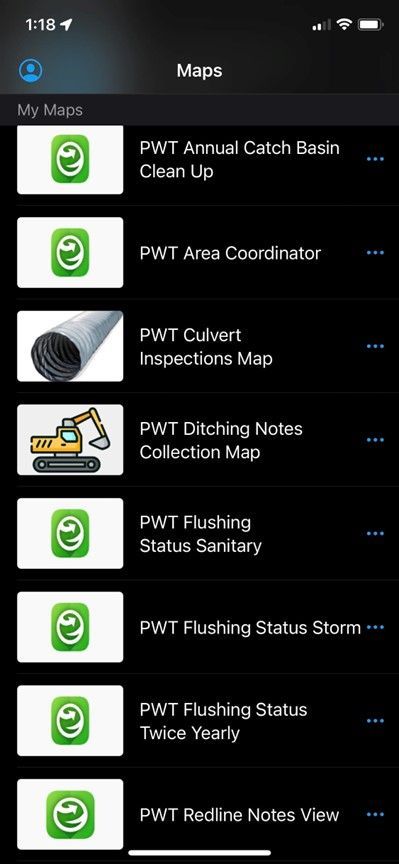
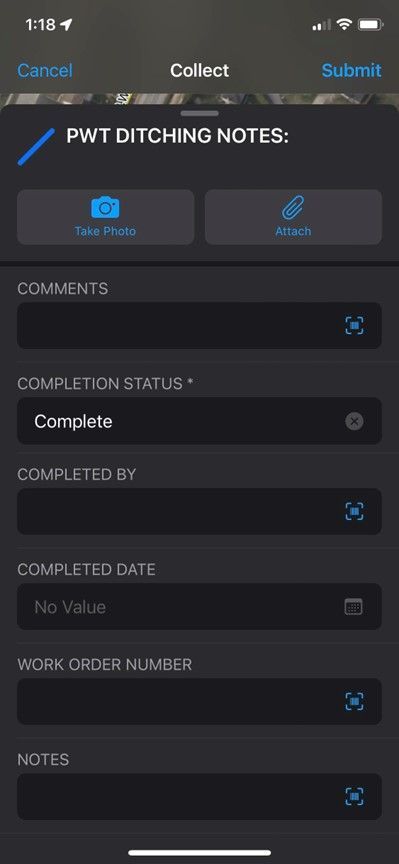
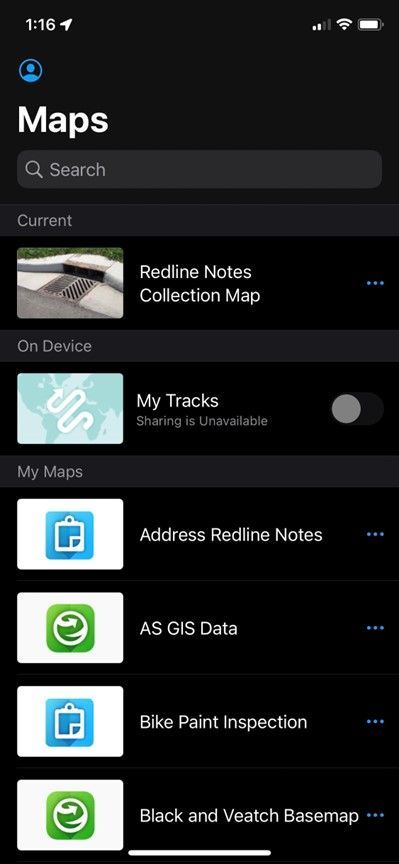
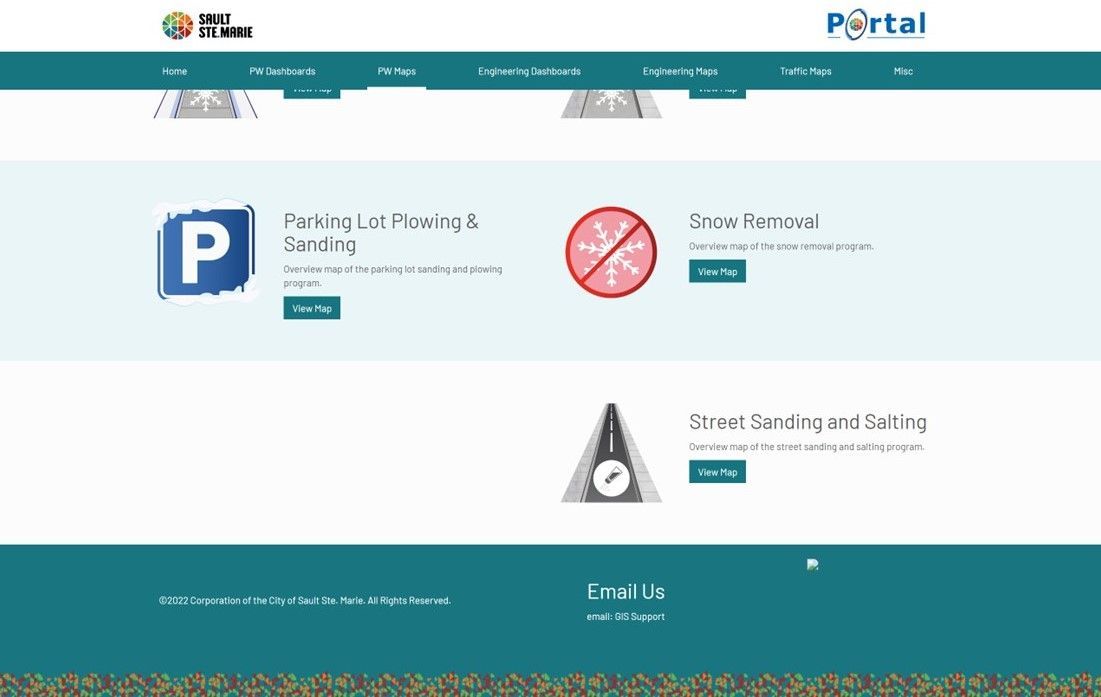
Public Works Field Maps
Municipal Engineering Dashboard
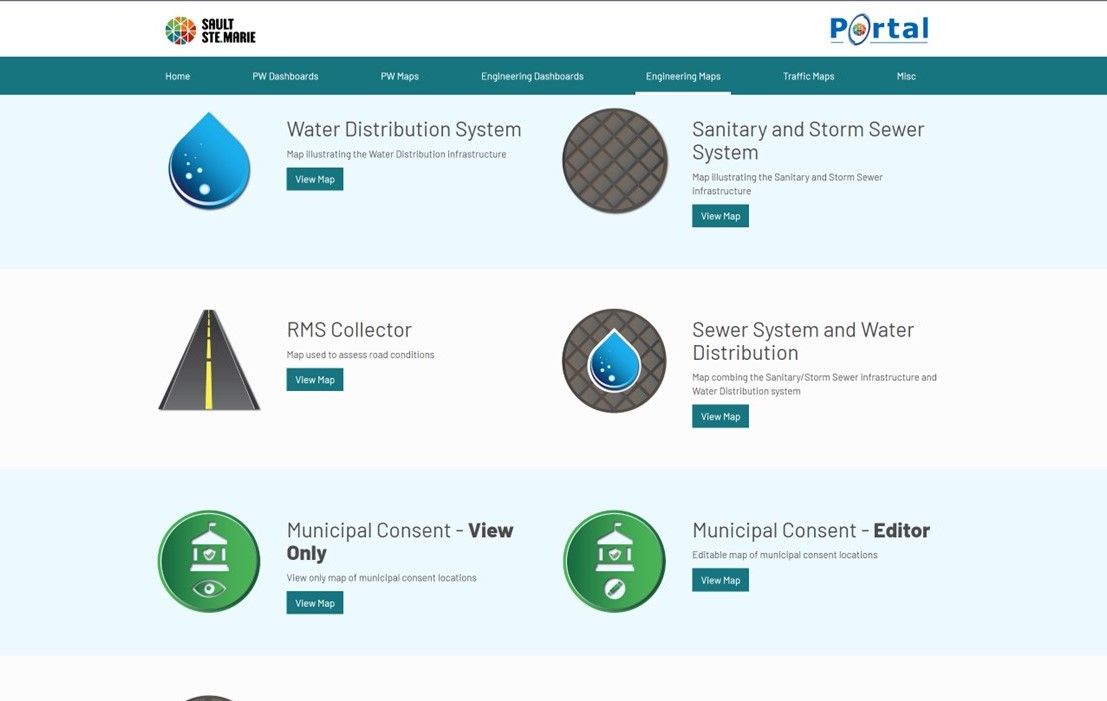
These desktop web maps are also accessible via cell phone for real time editing, this is the marvel of modern GIS and where the future is headed.